Dashboard
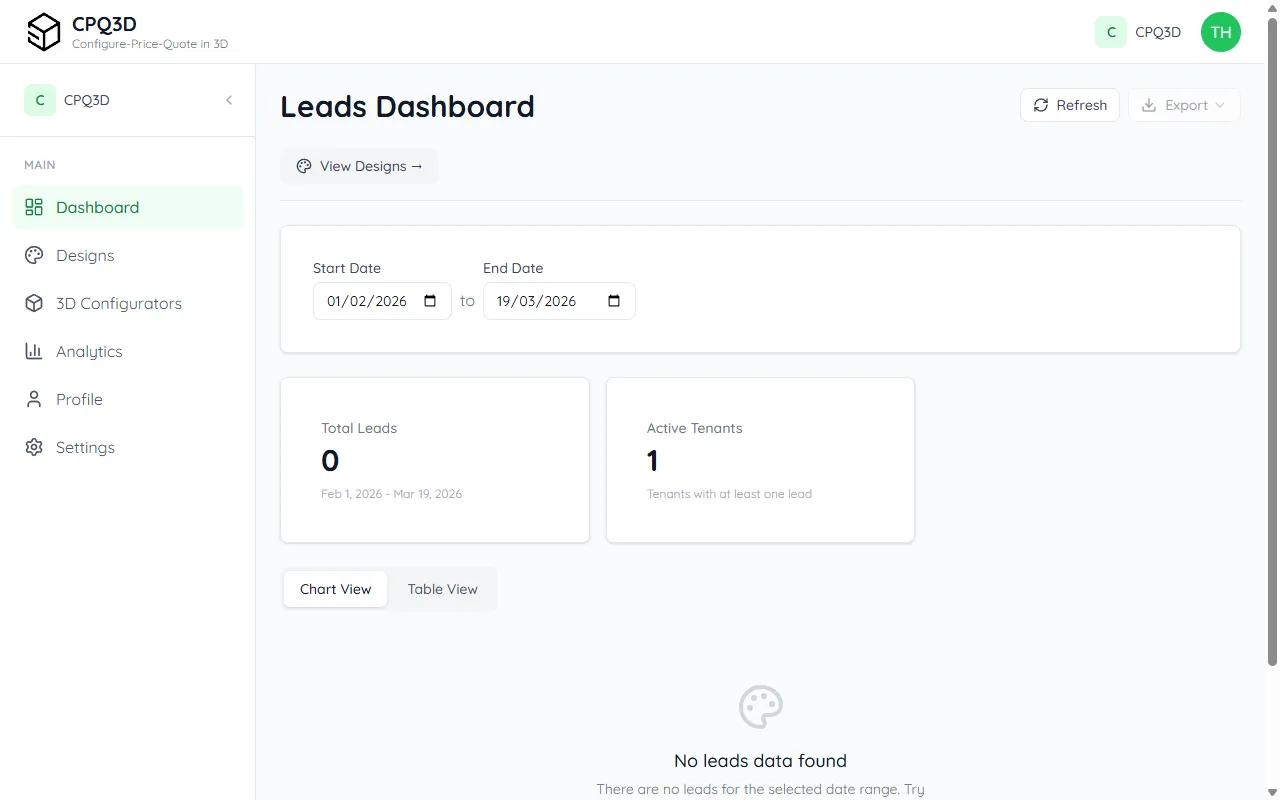
The dashboard is where you see the results of your 3D configurator. Every time a visitor on your website designs a product and submits their details, it shows up here as a quote request. You also get an email notification immediately — so you never need to log in just to check.
See who's interested
A quote request is what happens when a visitor on your website uses the 3D configurator: they design their ideal product, fill in their name and email address, and click "Send request". You receive their full configuration — model, size, colours, extras — along with their contact details, ready for you to follow up.
The quote requests list shows all incoming requests in reverse chronological order (newest first). Each row shows the customer's name, the date, and the current status.
What's included in each request
- Customer's name, email, and phone number — all you need to follow up
- The exact product they designed — model, dimensions, colours, and any extras they selected
- Date and time — when they submitted the request
- Status — New (not yet opened), Viewed, or Archived
You get an email for every request
You don't need to check the dashboard to stay on top of new requests. CPQ3D sends you an email the moment a new quote request comes in. The email contains everything: the customer's contact details and the full product specification. You can reply directly from your inbox.
Each request uses one credit
CPQ3D works on a pay-per-request model — no monthly subscription. Each quote request uses one credit from your balance. You start with 10 free credits, and can buy more at any time from Settings → Billing.
Understand how visitors use your configurator
The analytics section shows you what's happening inside your 3D configurator — not just how many quote requests you received, but how visitors are behaving: where they drop off, which products they configure most, and what your overall conversion rate is.
This helps you understand whether the configurator is working well, and where there might be room to improve. For example, if many visitors open the configurator but drop off at the colour step, that might indicate the colour options need clearer labelling.
What you can see
- Quote requests over time — a chart showing daily, weekly, or monthly request volumes so you can spot trends
- Conversion rate — the percentage of visitors who open the configurator and actually submit a quote request
- Drop-off analysis — which step in the configuration process causes the most visitors to leave without completing
- Popular products and options — which models, colours, and extras your visitors choose most often
Filter by date range
Use the date picker at the top of the analytics page to compare different time periods — for example, this month vs. last month, or before and after you added the configurator to a new page on your website.
Was this page helpful?
Thanks for the feedback!